Getting the Most Out of Google Analytics
Have you ever wondered how many people visited your site last month? Was that number better than the year before for the same month? Did people come to your site from Facebook, or from a Yelp Review? How long do they stay on your site, and how many pages did they look at?
All of this is easily tracked with Google Analytics. Google Analytics (GA) gives you all of this information and much more for free. We are going to help you get the most out of your GA dashboard.
How to Login
We have GA set up for every single website that markets with us. We will have logins set up so you can view your own GA at any time. If you are not sure what your login is, let us know and we can be sure to send your credentials over.
In this blog, we are going to cover a special layout we have created for your site. It is called “Roadside Template” and is found under >Dashboards>Private>Roadside Template on the upper left part of GA.
Changing the Dates Displayed
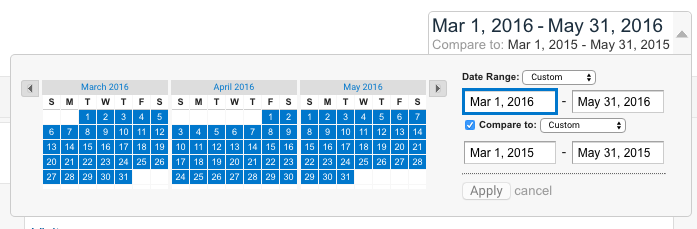
GA will usually default to your site’s performance in the last 30 days. But you can set it to display any date range you would like, starting with when GA was first setup. You can even click a “compare” button to show two separate periods of time simultaneously. This option is in the upper right of GA.
Navigating the Roadside Dental Marketing Template Dashboard
Visitors and Unique Visitors
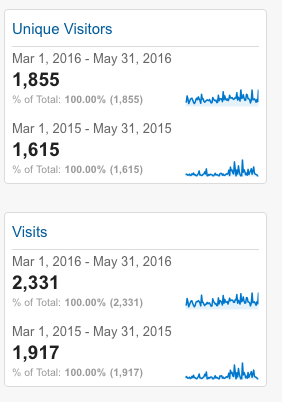 Now that you have the dashboard open, and the dates you would like to see filled in, you are ready to roll. The first column you will see will be Unique Visitors and Visits. Unique Visitors are how many different individuals came to your site.
If one person visited your site 20 times in a month, this will still only show up as one Unique Visitor. However, visits is the opposite. It shows how many total visits came to your site. So, if that one person came to your site 20 times, it will count as 20 visits in this graph.
You will also see a week-by-week display of Visits. This will help you to see what weeks had high traffic, and what weeks were average or low. If you see a spike in visits, ask yourself: What was special about that week? Did you run a promotion? Was school out? Did you run a campaign on Facebook? If you see a spike in visits, try to duplicate what caused it.
If you see a dip in visits, again, try to find out why. Were you sick that week or on vacation, so very few people could come in? Perhaps remodeling or getting a new site built? All of these can be causes for a dip in views.
Social Network Visits
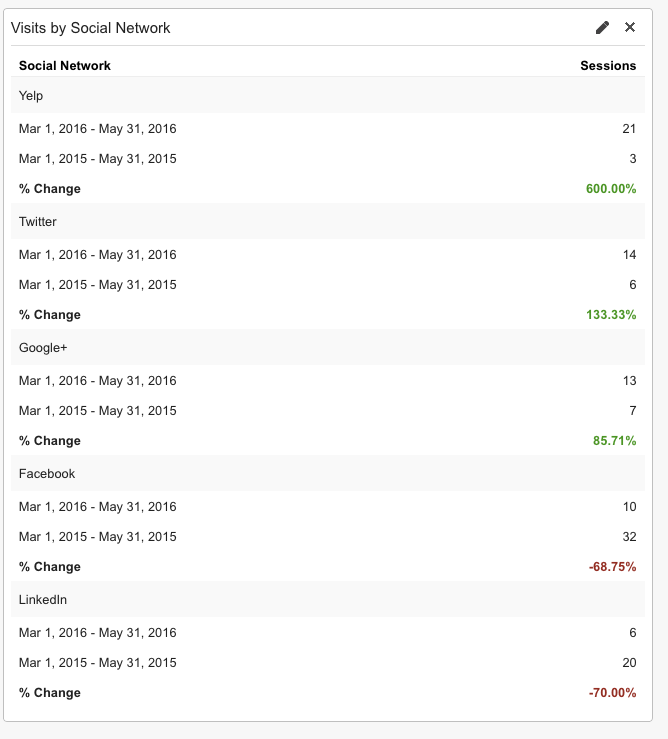 Roadside Dental Marketing is constantly encouraging our doctors to use social media. Sites like Facebook and Google+ have things such as “likes,” reviews, or +1’s to tell if people appreciate the information on your social platform.
Often, people will read something on a social network and want to know more. This desire to know more brings them to your site. This is what GA is tracking. They are tracking how many sessions were started through your social media sites.
Visits by Source
Have you heard people say you need to optimize for Bing and Yahoo? Well, how much traffic do other search engines really send to your dental website? How many people type in your URL directly because they already know it and don’t need to use Google to search for it? This is the information that Visits by Source provides. It will tell you how people arrived on your site.
Pageviews by City
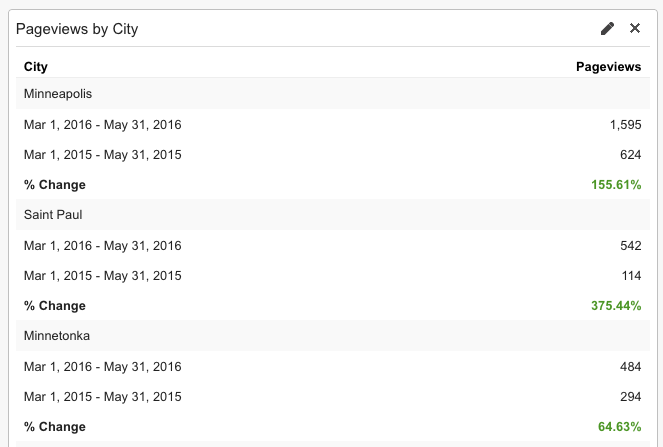 This category is great for seeing where people come from. Are they coming from your main city where your office is located? Do you find that a lot of your views are from outlying areas?
You may want to target your marketing to other cities if you find you are already getting a strong response from them.
The Rest of the Template
- Pageviews – This shows how many individual pages were clicked on.
- Bounce Rate – This shows who came to your site and left quickly with clicking on any links (this can happen when all they are looking for is a phone number).
- Avg. Pages per Visit – Pages visited divided by Visitors.
- Pageviews by page – Graph showing the most popular pages on your site.
- Visits by device – This shows if people come to your site with a phone, tablet, or computer.
Have more questions about Google Analytics for us? Feel free to ask away in the comment section below.