Google Analytics can be extremely complicated. The vast majority of data that Google collects on your site can be reviewed. You can look at what model phone is used, what time of day your site was found, how long visitors were on your site, which pages they read the longest, and the list goes on and on.
We are here to make
Google Analytics easy!
We've narrowed down the 8 most important Google Analytics topics for dentists and medical professionals. We will help you make sense of the data we send you, so you are empowered to make smart marketing decisions. This also enables you to review your website performance with complete transparency.
Click to jump to the section you are most interested in:
Users and Sessions
On any given day there are many things happening on your website, which means Google is tracking a vast quantity of information. At times, it can be difficult to grasp all the technical data
Google Analytics throws at you in your monthly report.
Roadside Dental & Medical Marketing wants to help. Two metrics worth your time and attention are your
Users and Sessions. Let’s break them down.
What are Users in Google Analytics?
A “User” is a person. Google wants to track how many individual people visit your site. So, if one User visits your site 100 times, it will still only count as one User in your GA statistics. This is useful for you to track how many individuals have visited your site, and is also beneficial for monitoring potential new customers. If you want to know exactly how many different patients came to your site last month, this is the place to look.
It is worth noting that Google tracks Users by the device they use. So, if you have one customer who views your site from their phone, then computer, then tablet, they would count as three users.
What are Sessions in Google Analytics?
A "Session" is when any User visits your site. Each time any User visits your site, this will count as one Session. One person could visit your website 100 times, and it would count as 100 Sessions. Why is it important to track this? This statistic is excellent for tracking returning customers. Many of your patients come to your office at least twice a year. Sessions will show you if they are visiting your site multiple times as well.
This metric highlights the reason why you need to update your site regularly, as people won’t read the same material over and over.
Where can you find your Users and Sessions?
Log in to your
Google Analytics account. In the left side-bar, click on
Audience>Overview. This will bring up a page with multiple stats to track. Included here are both Users and Sessions.
Google defaults to only showing you stats for the last seven days. We recommend looking at stats at least by month. In the upper right corner of
Google Analytics, you will see a date range. You can quickly change the dates tracked here.
Demographics
Most of us go to
Google Analytics to see how many clicks our website is getting. We like to know if our keywords are generating clicks, and what pages people are visiting on our site.
Google Analytics is excellent for all of that. But, it can do so much more. With Demographics data, you can see if most of your visitors are men or women, and you can even see their general age.
Where does Google Analytics get the data?
Does it seem a little creepy to you that Google knows this about your website visitors? Where exactly does the data originate?
When people set up a Google account, they are asked to enter personal information, such as age and gender. Google identifies when a visitor is logged in while browsing a website that is running
Google Analytics tracking. Personal information is passively collected and associated with their website sessions.
Where can you find your Demographics data?
You can access information about your audience demographics by first logging into your
Google Analytics account. Then under Audience in the left panel, click
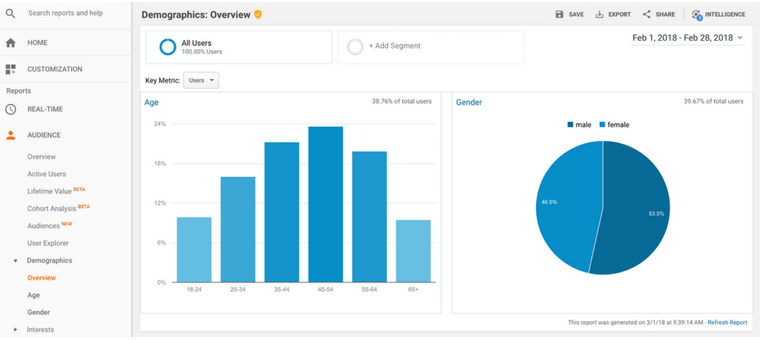
Demographics>Overview. The statistics will look something like this:
The overview will give you a great view of people that visit your site, with Age shown in the bar graph on the left, and Gender in a pie chart on the right.
How can you use your Demographics information?
As a dental or medical practice, the foundation of your
marketing strategy involves knowing who your target audience is for the services you provide. For example:
- Do you want more veneers patients?
- Are men or women more likely to get them?
- Are they usually in their 20s or 40s?
Analyzing the audience that is visiting your website lets you quickly see if you are attracting the demographic you want.
Is your target audience actually visiting your site?
If the
Google Analytics data about your audience indicates that people of particular ages or genders are visiting your site but not calling to book appointments, it could mean your website is not motivating them to take action and schedule an appointment.
Is there is a demographic you want to improve? Speak with your Account Manager about how creating new content specifically aimed at your target audience can increase the likelihood of conversion. Understanding your demographic metrics can make your
dental website more attractive to your target audience and improve the impact and return of your online advertising.
Behavior Flow
You have a website, and maybe you are already tracking data such as sessions, time on your site, and bounce rate. But is there a way to see the path a user takes? What page do they start on, where else do they travel on your site, and what pages do they exit your site from?
Behavior flow answers all that. It shows you the journey, from start to finish, that your users take.
How can you find Behavior Flow reports?
In
Google Analytics, look at the menu on the left side. Find the Reporting Tab, navigate to
Behavior>Behavior Flow.
Why is Behavior Flow important?
Behavior Flow gives you a very easy visual map of the path your visitors take. This will include all pages they visit in the order they visit them in. That may be a single page, or it may be them reading every single blog on your site.
For example, let’s say they start on your homepage, read your meet the doctor page, and end on your contact us page. The user path will be: Home > Meet the Doctor > Contact Us.
Why is this information beneficial? And how can you use it to grow your business?
Since
Behavior Flow shows you the "well-traveled" paths on your site, it can be used to help prioritize which pages to add trust-building content to.
Social Media Examiner illustrates it this way:
"When you have a great piece of content such as a beautiful testimonial or a compelling visual, you want to put it where people are more likely to see it. If your website was a city with a highway flowing through it, you’d put your billboards on the highways, not on little backstreets."
Behavior Flow tips
- Use Behavior Flow to visualize which pages people travel to the most often.
- Identify problems or patterns that show why some of your important pages are not being viewed.
Keep using
Google Analytics - don’t be afraid to explore it! If you have any questions, we're here to help! Simply schedule a time on Angela's calendar below for a free, no-strings-attached consultation.
Schedule a Free Consultation
Pages Per Session
Pages per session is an extremely valuable metric found in
Google Analytics. It combines both pageviews and sessions from each visit to your site. Are your viewers looking at five pages each? Do they only view one and then leave?
Does your website pull people in to peruse all of your content? Pages per session can give you some answers.
Where can you find Pages/Session in Google Analytics?
Finding your Pages/Sessions is easy. When you are logged into your
Google Analytics account navigate to
Audience>Overview. Right in the middle of the page, there are eight quick reference statistics.
Pages/Session is the very last one.
What should your goal be for Pages/Session?
There is no industry standard for an average of pages per session. Much of your site is designed to answer common questions right on the home page. After all, your telephone number, social links, operating hours, and mission statement are all usually found right on the homepage. Many times, there is no need for a user to click on more than one page.
However, if you have a
vibrant dental or medical website it is beneficial to track when your patients are making the most of it. Our goal at
Roadside Dental & Medical Marketing is to see an average of two pages per session. At first, that may seem low, but remember that each patient who finds what they want on your homepage and leaves will only view one page. These viewers bring your average down.
What can you do to increase your Pages/Session?
If you find that your pages per session are low, there are several options.
- Make sure your site wows users. Your visitors will form an impression of you and your business with a quick glance at your homepage. For the same reasons you keep your waiting room decor fresh and modern, if you have a site that looks dated, it is a turn-off for potential patients. They may immediately leave for another website on Google that looks more inviting and has advanced features, like responsiveness and videos.
- Consider improving the calls-to-action (CTA) on your homepage, especially if you have a new site, but you don't see many pages viewed. CTAs should inspire action and can be improved by changing size, verbiage, and even color. Powerful CTAs may include a no-obligation statement (like "Try us"), encouragement to act immediately (like "Download your offer now"), or giving them instructions for what to do next (like "Click Play").
- New fresh content on your homepage, in your blog, or about your team will motivate patients to look through what’s new on your site even if they've been there before.
Customer Loyalty
Customer loyalty is huge. Once you have a happy patient, many times they will stay with your practice for life. In fact, do you have customers that have moved a little ways away, but still travel a longer distance just to come to see you and your practice? That is a perfect example of customer loyalty.
Not only will a loyal customer keep coming back, but they can often be your best referral resource. They can bring their entire family to your practice, and even tell coworkers and friends to see you as well.
Tracking Customer Loyalty in Google Analytics
Google Analytics lets us track a similar statistic:
Customer Loyalty. Specifically, customer loyalty is made up of two statistics: visitors who have come to your site for the first time (new visitors), and those who have visited at least once in the past (returning visitors).
To find this statistic in
Google Analytics, go to
Audience>Behavior>New vs Returning.
How does Google track this information?
Google isn’t able to track this perfectly. It only tracks returning devices. This means that if one person finds your site on their phone, and then next month find your site on their computer, it will count as a new user, not a returning user. Even if someone buys a new phone, Google views him or her as a new user, not a returning one. Despite these limitations, it is still useful to see how many returning or new visitors you have.
How can you use Customer Loyalty information to your benefit?
We like to see a returning visitor percentage of around 15-20%. Feel free to login to your
Google Analytics and see where your site's range is. Looking at this data can be very informative. It can help you see if your marketing techniques are bringing in primarily new people or engaging those who are already your customers.
If you see an area for improvement, we're here to help!
Call or email us for practical tips to help your dental and medical practice's online presence to grow.
Contact Us
Social Engagement
There is no debating the benefits of having a strong presence online for social engagement. A strong presence includes not just having a website or a blog, but engaging people on the social networks they use most. A 2016 social media study showed that
86% of Americans use the internet. And of those,
79% use Facebook (
source). That is the vast majority. People do not only use social sites to send photos, silly memes, or play games. For many, it has become the main way they learn about what is going on in the world. This is why we tell all who work with
Roadside Dental & Medical Marketing that an authentic social media presence will have a direct effect on your business.
How to track success on social media
There are many ways to track success on social media:
- Each time someone “likes” a post you make
- Each time they comment on a photo
- Each time they leave a review or “favorite” your post
All of these are successes! You have put out some sort of original content that your patients appreciate. They are more likely to remain your patient for years to come, and when they remember you and your practice they are more likely to tell their friends and family to go to your office or connect with you online.
How does Google Analytics track social engagement?
Google Analytics tracks one very specific form of engagement from your social media sites.
Roadside Dental & Medical Marketing has perfected getting all of your social accounts built and optimized. Along with this, a link to your website is present on all your social media accounts. Each time someone clicks on a link to your website while visiting one of your social media sites,
Google Analytics is able to track it. So, if while on your Facebook page, a user decides they want to learn more about you and perhaps make an appointment, they will click on your URL that Facebook has displayed. These clicks are what show up in this report.
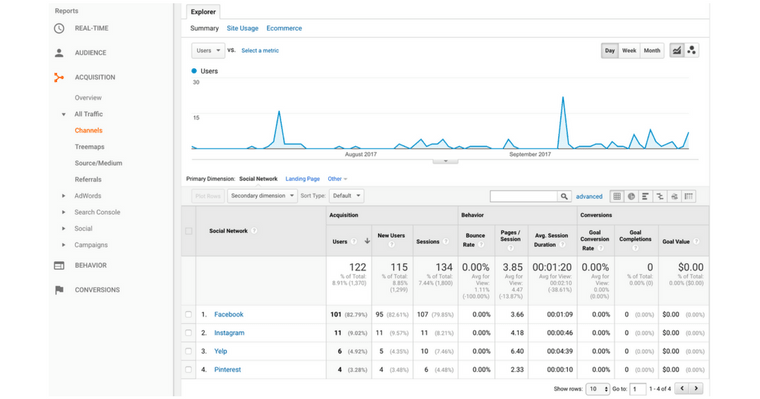
Here is an example of what it looks like in
Google Analytics:
You can see what social sites are getting the most engagement. You are even able to see what days had big jumps in traffic. The example above shows two spikes on the timeline. If this were your site, you could go and see what posts you put up that day. This would tell you what is really clicking with your patients so you could gear more posts to be a similar theme.
Event Tracking
We want to help you analyze engagements on your website using event tracking on your
Google Analytics Report. Your website accomplishes a lot. It tells people about you and your office and they can see what services you offer. Most sites also have a blog with tips to stay healthy. But, we don’t want your site to simply provide information. We want your patients to act,
to engage.
How to track Engagement
First of all, what do we mean by "engagement?"
Engagement is a website visitor's response to some kind of offering, such as a button on your website to call the office, request an appointment, or get directions to your office. The way your pages are written and organized should motivate a user to do more.
With
Event Tracking, we can see where people are engaging the most, and where we can improve. The events we choose to track in
Google Analytics are ones that show your patient has looked at your site and is moved to take action to reach out to your office. This is done in multiple ways.
Examples of Tracked Events:
- Directions: Your patients are interested in your office and want to see how close you are, or simply need directions.
- Request an Appointment: Your site has succeeded in gaining your patients' interest and they email your office.
- Click to Call: All phone numbers on your site can be clicked to instantly dial that number (if someone looks at your phone number online, but then simply dials it on their phone, it will NOT show up as a Click to Call).
- Download: There is an eBook or resource your patients were intrigued by and downloaded.
- Review: Your patients were moved to click on your “Leave a Review” button to tell others about your office.
These are only some examples. Your site likely is tracking many of these events, but each site will vary.
Improving what your website is doing for you
If you ever worry that you are not getting enough phone calls or wonder if your site is doing enough, Event Tracking will help you see all that your site is accomplishing for you. The goal of your site isn’t simply phone calls alone. Your site is a resource for any and all information your patients want about you, your experience, your office, and your team.
Exit Pages
When analyzing your monthly
Google Analytics Report, you may only focus on increasing traffic by looking at keywords that brought people to your site, and the first page they clicked on. These statistics are crucial -- you want new visitors! But
Exit Pages help you to see why visitors left. How can you use this information to improve your website?
What are Exit Pages?
Exit pages are the last page a visitor clicks on your site. This data can be extremely helpful to evaluate your pages. Was the content on this page weak or uninspired? What improvements are necessary? Exit page data can assist in
keeping people on your site once they get there.
Where can you view Exit Pages in Google Analytics?
You can view a list of your site’s exit pages by going to
Behavior>Site Content>Exit Pages.
What should you do if one page has a lot of Exits?
If you notice a specific page on your site has a lot of exits, you'll want to ask why. Some pages are designed to be the end of a tour on your site. The Contact Us page is a great example. Here is where a visitor makes an appointment, gets directions, or calls you. That's a successful exit!
However, if other pages on your site seem to have a lot of exits, now is the time to make some improvements.
- Is there a motivating call to action on that page that prompts visitors to keep looking at your site?
- Does the page clearly provide a way for the visitor to find additional information by linking to blogs, pages, or other websites?
A high exit rate suggests that a particular page is losing visitors and may be a good candidate for
A/B testing to keep users around longer. Every user will exit at some point, but the better the overall experience, the longer they’ll stay.
Knowledge is Power
There you have it: Eight of the most important factors to consider in
Google Analytics. This guide should be incredibly helpful to know exactly what is being reported to Google and give you a clear understanding of how your site is holding up.
We encourage you to log in to your
Google Analytics Account and look at the numbers for yourself. You can always ask your account manager how to access your account.
All of the data that is collected really is fascinating! The more you understand, the more you will know where your site is excelling, and what areas need work.
It will put you in control of your marketing, and help you to make informed decisions. Refer to this blog whenever you need help with
Google Analytics and
contact us if you're interested in improving your dental SEO!
Contact Us